
Snohomish County Q1 CRE Market Note
A Note from Rob
If I had to sum up the Snohomish County commercial market in one sentence, it would be this: the market is not frozen, but the cost of capital is still weighing heavily on the market. A lot of people came into this year hoping rates would ease and deal activity would pick up. That has not really happened. Borrowing costs are still elevated, and that continues to pressure pricing, deal volume, and seller expectations. What I am seeing most right now is not panic. It is hesitation and very thorough underwriting.
Snohomish County-wide Snapshot
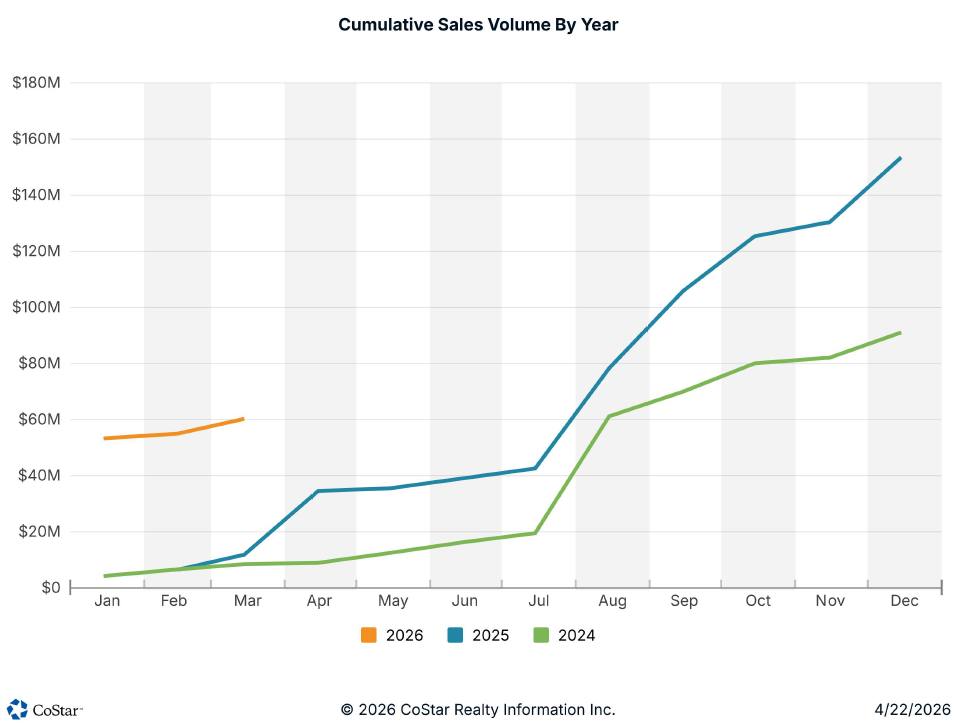
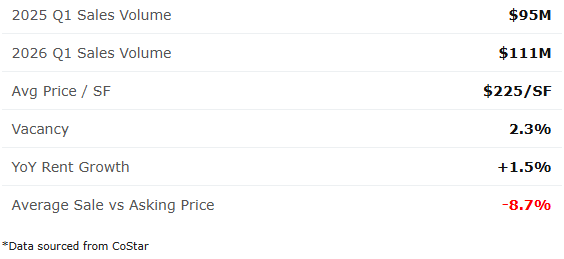
The data below illustrates the broader state of the countywide market. Deals are still moving, but they are moving slowly. With deal volume down 4.3% year over year and an average sale-to-ask gap of 6.8%, the message is clear: sellers need to price closer to where buyers can actually underwrite the deal if they want to get something done. Elevated borrowing costs are forcing tighter underwriting, more conservative assumptions, and a more cautious approach overall. If sellers are swinging for the fences, buyers are going to move on. In this market, pricing has to account for the buyer’s perspective, pain points, and cost of capital. The 50% drop from Q4 2025 to Q1 2026 is worth acknowledging. Q4 consistently attracts deal activity driven by tax planning, fund reporting deadlines, and the simple motivation to close before the holidays. Q1 comparisons against that backdrop tend to look worse than they are. Year over year is the more useful lens here.
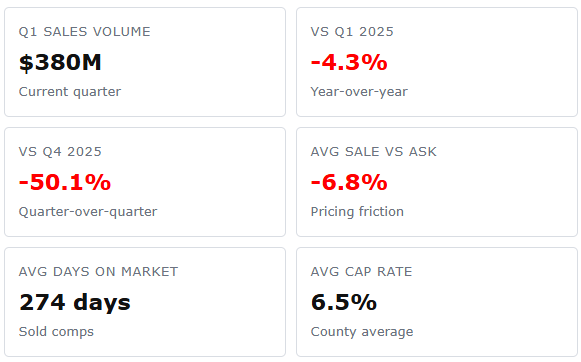
All data source from CoStar
In practical terms, that means more stalled conversations, more price reductions, and longer hold times for properties that miss the market.
What This Means For You
Sellers: If you want to move an asset in today’s market, you need to price accordingly. Consider the factors specific to your property, consult with a broker who understands the local buyer pool (hopefully me), and then run your price through the buyer’s lens. Does it pencil at today’s interest rates? Is there room for error? Is your vacancy assumption in line with market realities? Are the lease terms, tenant quality, and property condition strong enough to support the number? The more attention sellers give to these details up front, the faster their assets are likely to trade. The market will speak. It always does. Hovering above the market usually just racks up holding costs.
Buyers: Stay disciplined. The data suggests buyers have been doing exactly that. Interest rates remain elevated, uncertainty is real, and the competitive landscape continues to shift. Buyers are right to be cautious, and anyone advising them to ignore risk is likely giving bad advice. Carefully evaluate the data, allow margin for error, and stick to your metrics. No deal is better than a bad deal.
Q1 Snapshot by Asset Type
Multifamily
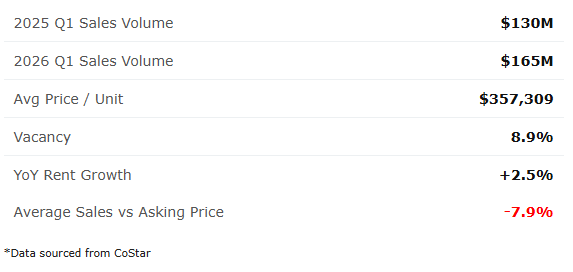
A few things jump out in the multifamily data. First, year-over-year sales volume is positive, which is encouraging. The more important story, though, is price per unit. Several Q1 transactions closed well above the roughly $300,000 per unit level that has been more typical in the county. Most notably, a 114 unit property in Lynnwood near Ash Way sold for almost $680,000 per unit. That property was purchased by the Housing Authority of Snohomish County using revenue bonds, and its location near the future light rail station likely had a significant impact on pricing. A 383 unit project near Alderwood Mall that was completed in 2023 also sold at just under $370,000 per unit.
The point is not that every multifamily property in Snohomish County is suddenly worth more. Early Q2 data suggests returning to $265,000 average price/unit. There's still time for that number to move, of course, but significant movement will require another significant sale, which will likely be an outlier when compared with the broader market. The point is that a few exceptional transactions moved the Q1 average well above the norm. Price per unit is useful, but only when the comparison set is truly comparable. Location, age, condition, unit mix, financing structure, and buyer motivation all matter. Owners should keep that in mind when pricing their assets. Trying to get new-construction pricing for a 30-year-old building is not a strategy. Buyers will simply move on.
Retail
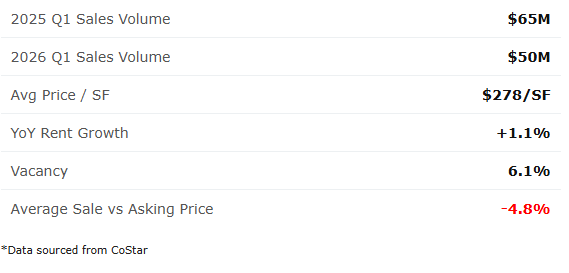
Unlike multifamily, retail deal volume declined, dropping from roughly $65 million in Q1 2025 to $50 million in Q1 2026. That does not mean retail is falling apart. It likely means fewer larger or more highly rated assets traded hands. The smaller neighborhood centers and standalone retail buildings that make up much of the local owner-user and investor market continue to represent a steady portion of countywide activity, accounting for roughly $15 million of overall deal volume.
The pricing story is more stable than the sales-volume number suggests. Price per square foot and average cap rates remain generally in line with the last three years, with small but consistent year over year improvement. High construction costs and low vacancy should give buyers confidence in well-located retail, especially when the income stream is durable. But sellers still need to be realistic. Limited new construction and low vacancy are real strengths, but they do not automatically justify inflated pricing. Buyers are still going to underwrite the income stream, tenant quality, lease rollover, and replacement risk.
Industrial
Industrial looks healthy overall, but the category needs to be broken down. Flex vacancy is effectively nonexistent across the county, while logistics vacancy remains low and specialty industrial is much softer. That supports what I am seeing on the ground: demand is strongest for flexible, functional small-bay and micro-bay space.
Contractors, service businesses, storage users, light manufacturers, trades, and similar companies need space that is affordable, accessible, and hard to replace. Small-bay and micro-bay spaces serve that demand better than many larger industrial buildings, especially for users that do not need full logistics infrastructure. That is where the pressure feels strongest.
“Industrial” is not one market. A micro-bay contractor space, a yard-heavy service property, and a larger logistics building are not valued the same way. Sellers still need to price based on functionality, tenant quality, access, loading, power, yard area, and whether the income supports the price.
Land/Development
I do not put much weight on sales stats and land averages for this category. Price per acre and price per square foot can be almost meaningless when the data does not account for usable land, zoning, utilities, wetlands, access, infrastructure costs, or entitlement progress. Two sites can look similar on paper and have completely different values based on what can actually be built.
For land and redevelopment properties, the real questions are simple: how much of the site is usable, what can be built, how long will it take, and what risk remains? That is what drives value. A random average does not.
Office
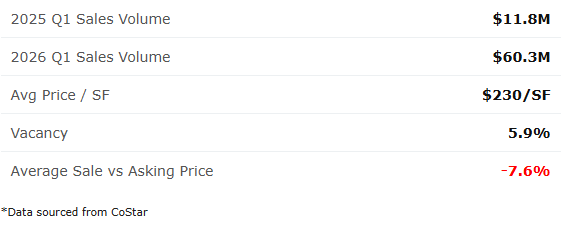
The headline number in office is the large increase in deal volume, but that number needs context. Roughly $48 million of the $60 million in Q1 2026 office volume came from the sale of one building in Lynnwood. That transaction moved the overall volume number, but it does not tell the full story for the smaller and more typical office assets most local owners actually care about.
For 1- to 3-star office buildings, deal volume was roughly the same in Q1 2026 as it was in Q1 2025. In other words, the jump was driven by trophy and higher-rated assets trading, not by a broad recovery across all office properties.
The office buildings that are moving tend to have a few things in common: they are clean, in good condition, occupied, or well suited for an in-demand owner-user. Buildings with deferred maintenance, awkward layouts, weak occupancy, or no clear user profile are a much harder sell. They either are not moving, or they are needing to offer significant discounts to get a buyer’s attention.
Need a Straight Opinion?
If you want a straight opinion on value, leasing risk, redevelopment potential, or how your property is likely to read to actual buyers in today’s market, I’d love to help. I’ll give you a practical read without a sales pitch. Reach out today.