Why Industrial Real Estate Remains Attractive to Investors in 2026
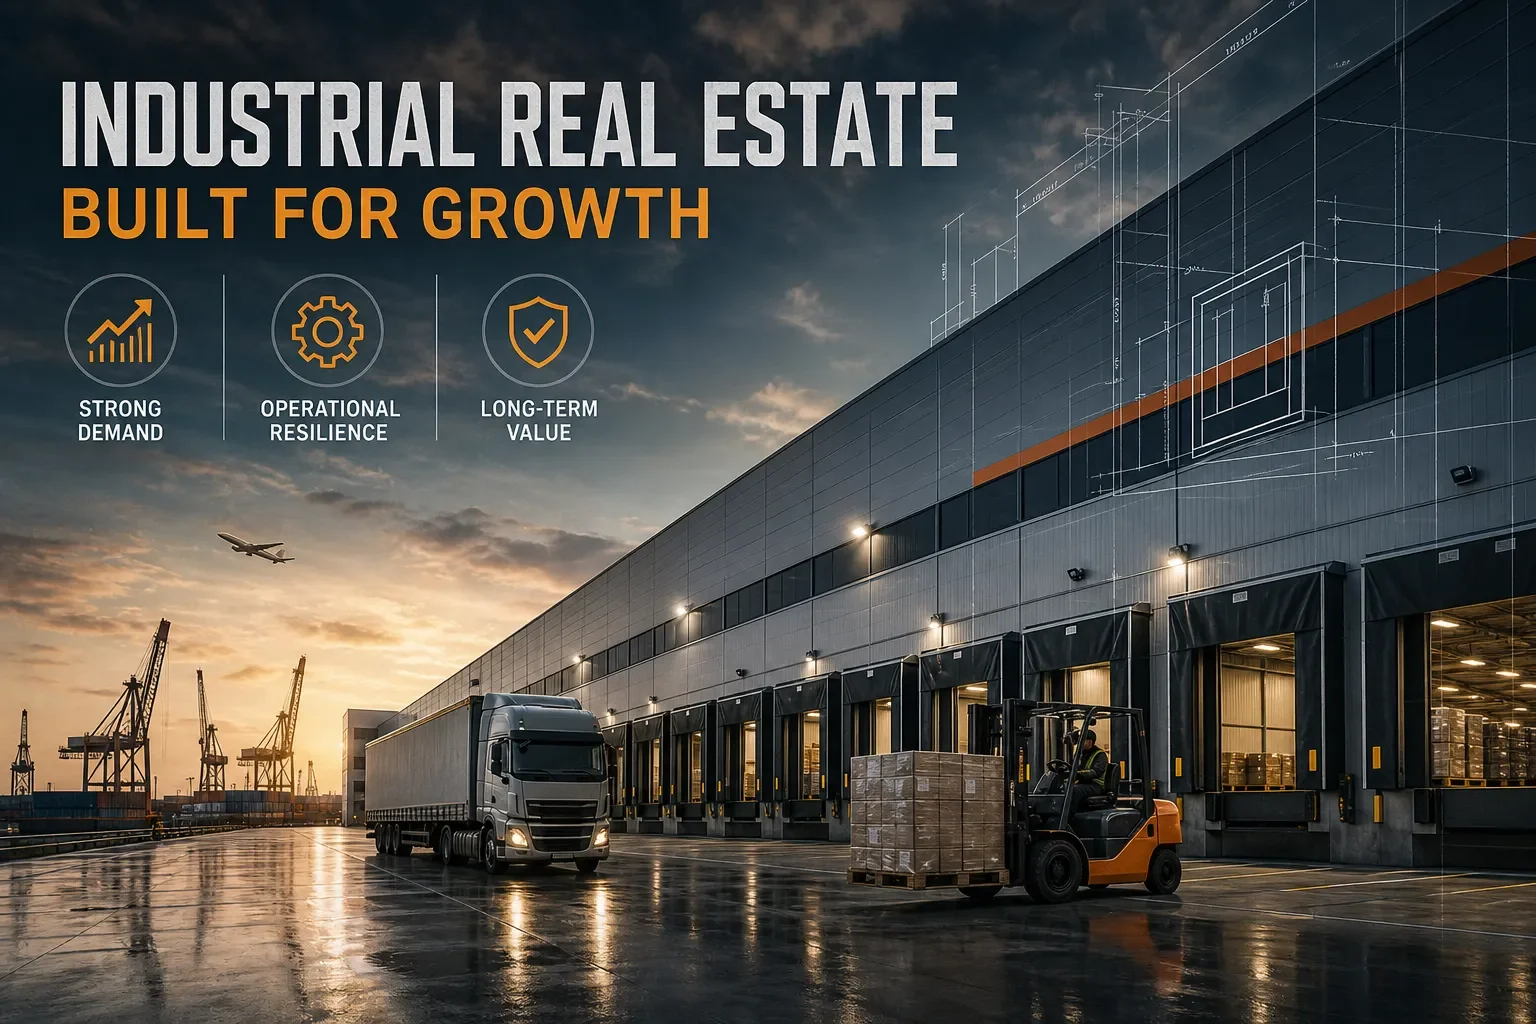
Why industrial real estate remains attractive to investors in 2026 comes down to fundamentals that other commercial property types simply aren't delivering right now. Office buildings continue to carry elevated vacancy, and retail is navigating its own structural recalibration, shifting store counts, expanding omnichannel formats, and repurposing underperforming space. Meanwhile, industrial real estate is posting a national vacancy rate of roughly 6.9% and rent growth of +2.9% year over year as of mid-2026. Those numbers don't reflect a temporary spike. The structural forces behind warehouse and logistics demand have been building for years, and the fundamentals keep delivering for investors who understand what's driving them. From what the team at Serviss Commercial observes across the North King and Snohomish County corridor, investor interest in industrial assets has remained consistent, a pattern that aligns with national capital flow data and investor surveys showing sustained institutional appetite for logistics real estate. This article breaks down the primary drivers behind that performance, how industrial compares to other property types on key metrics, which strategies and submarkets make the most sense in 2026, and what any serious investor should review before committing capital to this asset class.
Why industrial real estate remains attractive to investors: structural demand drivers
Industrial real estate demand isn't being carried by a single trend. Two major macro shifts have permanently raised the floor on how much warehouse and logistics space the U.S. economy needs, and both of them accelerated after 2020.
How e-commerce reshaped the math on warehouse space
Online fulfillment is fundamentally more space-intensive than traditional retail distribution. CBRE estimates that e-commerce fulfillment requires roughly three times the logistics space of brick-and-mortar retail distribution, translating to approximately 1.25 million square feet of warehouse capacity for every $1 billion of incremental e-commerce sales. E-commerce's share of U.S. industrial absorption jumped from 28.2% between 2016 and 2019 to roughly 40% in 2020 and 2021, and it has stayed elevated since. This isn't a pandemic anomaly. It's a structural demand multiplier built into how consumers buy goods and how companies fulfill orders.
The reshoring and "just in case" inventory shift
Supply chain disruptions after 2020 pushed companies away from lean "just in time" inventory models toward higher safety stock buffers distributed closer to end customers. Reshoring domestic manufacturing and distribution adds another layer of demand: more U.S.-based industrial space near population centers. Combined, higher inventory levels and more distributed logistics networks have become long-term demand anchors for last-mile distribution centers and regional warehouse investments across the country. These aren't short-cycle trends. Companies have restructured capital allocation and supply chain strategy around them.
Vacancy rates and rent growth: what the 2026 numbers are telling investors
Market narratives are easy to generate. Actual numbers are harder to argue with, and the 2026 industrial numbers make a clear case.
The national industrial picture in 2026
National industrial vacancy sits at approximately 6.9% as of Q2 2026. Asking rents are running around $10.32 per square foot per year, and CoStar data puts year-over-year rent growth at +2.9%. Vacancy has risen modestly from its 2021 and 2022 historic lows but remains tight relative to long-term historical averages. Net absorption continues to outpace new completions in most major markets, which is what keeps rents moving upward even as some new supply comes online. That supply-demand dynamic is exactly the condition investors want to see when underwriting future cash flow.
How industrial holds up against office and retail
Office is carrying materially higher vacancy nationally, with cap rates in the 7.3% to 9.5% range that reflect structural uncertainty and elevated credit risk rather than investment quality. Retail sits between the two, with stabilized cap rates roughly in the 6.2% to 6.9% range, though tenant demand is less predictable than in logistics-driven industrial assets. It's worth noting that retail often runs tighter on headline vacancy in certain markets, but industrial outperforms on rent growth consistency and tenant demand durability. For investors comparing property types, the combination of tight vacancy, steady rent growth, and durable logistics-driven tenant demand is what makes industrial the cleaner underwriting story in 2026.
Cap rates, yield spreads, and the return case for industrial assets
Return dynamics matter as much as fundamentals. Understanding where industrial cap rates sit today, and how they got here, helps investors assess whether current pricing still makes sense.
Where industrial cap rates sit today and how they got here
Prime institutional industrial cap rates sit around 4.5% to 5.5% in gateway markets and 5.5% to 6.8% across broader U.S. markets in 2026. Industrial cap rates are approximately 120 basis points above their 2022 lows after the rate reset, which means buyers entering the market today are doing so at better yields than the 2020 and 2021 peak. One 2026 net-lease market report places the average industrial cap rate at 6.7% versus a 10-year Treasury yield of 4.9%, implying a spread of roughly 180 basis points. That spread gives investors a reasonable margin over risk-free rates, which is the practical test for whether an asset class still makes sense at current pricing.
Why industrial cap rates make sense relative to the alternatives
Office cap rates in the 7.3% to 9.5% range look attractive on paper until you account for what's behind them: higher vacancy, structural uncertainty about long-term space demand, and tenant credit risk that requires more aggressive underwriting assumptions. Industrial's lower cap rate reflects strong demand, durable tenant profiles, and real rent growth potential rather than inflated optimism. The historical arc is instructive: industrial cap rates were near 4.0% to 4.5% around 2016, compressed through 2021, reset in 2022 and 2023, and have stabilized at levels that still offer a workable spread over Treasuries. Investors who understand that trajectory are entering a market that has already absorbed the repricing.
Submarket strategy: last-mile facilities vs. large-format logistics
Not every industrial asset performs the same way, and the strategy that fits your capital depends on your risk tolerance, hold period, and preferred entry point.
Last-mile distribution centers vs. large-format logistics facilities
Last-mile distribution centers in supply-constrained, infill urban submarkets, particularly inner-ring locations near dense population centers, tend to carry the tightest vacancy, the strongest rent growth, and the highest replacement cost protection. These assets are difficult to replicate because land simply isn't available at scale, which limits new supply from eroding your returns. Large-format, big-box logistics facilities in major distribution hubs like Dallas-Fort Worth offer higher absolute square footage and lower per-square-foot cost, but they require careful tenant credit underwriting because the supply pipeline is more active. The right choice depends on whether your capital is better suited to income stability at compressed cap rates or volume plays with more tenant concentration risk.
Build-to-suit projects and industrial REITs as entry points
Investors with longer timelines and development appetite can access e-commerce fulfillment real estate through build-to-suit projects, where lenders are currently offering 65% to 70% loan-to-cost on construction at 18 to 24 month terms before conversion to permanent debt. For investors not yet ready for direct ownership, industrial REITs offer a more liquid, lower-barrier entry into logistics real estate with diversified portfolio exposure. These options represent a spectrum, not a hierarchy. Direct ownership, build-to-suit development, and REIT exposure serve different investor profiles, and the strongest strategy is the one that matches your actual capital structure and time horizon.
How Snohomish County and North King fit into the national picture
National trends set the context, but local fundamentals determine whether a specific acquisition performs. The Pacific Northwest corridor has its own drivers worth understanding before deploying capital here.
Why the Pacific Northwest corridor is attracting industrial capital
Port access, continued population density growth in the greater Seattle region, proximity to major e-commerce distribution networks, and the relative affordability of Snohomish County industrial land and buildings compared to Seattle proper and South King County all point in the same direction. Companies building distributed logistics networks, the reshoring and last-mile deployment strategies discussed earlier, are targeting corridors like Everett, Marysville, Monroe, and the Highway 2 and I-5 corridors as viable options that don't require the premium pricing of core Seattle submarkets. Regional vacancy for the broader Puget Sound industrial market sits around 9.3% to 9.8%, with North Snohomish County running in the low double digits. That gap creates room for investors pursuing industrial investments in Snohomish County to acquire assets before the submarket tightens further.
What Serviss Commercial is seeing on the ground in 2026
As a full-service commercial brokerage covering Snohomish County and North King County, Serviss Commercial tracks leasing velocity, available industrial inventory, and investment sale activity in this corridor closely. The same macro forces compressing vacancy nationally are showing up locally: Amazon has a 222,000-square-foot distribution center operating on a 15-year lease in Everett, and the broader logistics leasing market across the Everett, Marysville, and Arlington corridor remains active. Seattle-area industrial cap rates are running around 5.2% to 6.3%, tighter than the national average of roughly 6% to 7%, which reflects the strength of the underlying demand story in this market. Investors considering North King County warehouse investments now are positioning ahead of the supply catch-up, and that timing matters for long-term return outcomes.
What to check before committing capital to an industrial deal
Understanding why industrial real estate is attractive to investors is one thing. Knowing how to evaluate a specific deal is what separates investors who perform from those who overpay or underwrite the wrong risk.
The financing environment for industrial acquisitions in 2026
Stabilized industrial acquisitions are financing at 65% to 75% LTV, with minimum DSCR requirements of 1.25x to 1.35x and debt yield expectations in the 7.5% to 9% range. Life companies and CMBS programs favor strong lease terms and credit tenants; they underwrite the tenant as much as the property. Bridge and value-add deals carry tighter leverage, typically 50% to 70% LTV, and higher pricing to reflect execution risk. Owner-users can access SBA financing at up to 90% LTV, a meaningful advantage for business operators acquiring their own facility. These are the parameters lenders are actually applying in 2026, and knowing them upfront shapes how you structure an offer.
The metrics that separate a good industrial deal from a risky one
Remaining lease term and tenant credit quality set the foundation. Clear height, dock configuration, and power capacity relative to current tenant demand determine whether the building can actually serve the logistics uses driving absorption. Location within the last-mile or regional distribution network affects how many prospective tenants can use the space if it goes vacant. Replacement cost relative to acquisition price gives you a read on how much new supply can realistically compete with the asset. Industrial cap rates near 6% or above still offer a workable spread in 2026, but deals dependent on aggressive rent growth assumptions or short-term lease renewals carry meaningful execution risk that needs to be priced in. Working through these variables with an experienced local advisor before making an offer makes a measurable difference in deal quality.
The bottom line: why industrial real estate remains attractive to investors in 2026
Industrial real estate remains attractive to investors because the fundamentals behind it are durable: structural demand from e-commerce and reshoring, tight vacancy relative to other property types, consistent rent growth, and a financing environment that still supports acquisitions at reasonable leverage. The asset class has reset from its 2021 peak pricing, which means investors entering now are doing so at better yields than the cycle high, with demand drivers that are strengthening rather than fading.
For investors evaluating specific markets, local dynamics matter as much as the national trend. The North King and Snohomish County corridor offers a concrete opportunity to get ahead of continued demand growth in a submarket that still has room to run. Industrial land and building costs remain more accessible here than in core Seattle, logistics demand is active, and the long-term demographic and infrastructure case for the region is solid. Regional vacancy in the low double digits across North Snohomish County means acquirers today are entering before absorption closes the gap.
If you're evaluating industrial acquisitions in Snohomish County or North King County, the team at Serviss Commercial brings deep local transaction experience and hands-on market knowledge of this corridor. Reach out to discuss what's currently available, what the numbers look like on specific deal types, and where the strongest opportunities are right now.